Project
Samsung Health Steps Analysis with Power Query & Power BI
Utilising Power Query & Power BI with my own Samsung Health daily Step Count Data

Goal
Daily Step Analysis from Samsung Health Data
Skills used
Data Extraction
Data Cleansing
Data Transformation
Exporatory Data Analysis
Power Query
Power BI
1. Downloading the data set
The first step was using a mobile device to download the data and the zip file extracted to a folder on my computer. Samsung Health data is split into over 60 .csv files. so exploring the files to establish what data I have and where would be the next step.

2. Examine Datasets
I identified several relevant files named:
com.samsung.shealth.tracker.pedometer_step_count.
com.samsung.shealth.tracker.pedometer_day_summary
com.samsung.shealth.step_daily_trend

3. First problem (Data source)
The first problem occurred on reviewing the data. As per the image below you can see the data is split with multiple entries for the same day which was somewhere between 1 -3. Although I was able to realise that one entry was for my phone and one for the fitness tracker wearable, the third value could not be explained.

4. I use various android apps that sync their data. My next step was to try and extract the myfitnesspal data however this appeared to be a paid feature and only support fitbit. I turned my attentions to an app called ‘HealthSync’ that i have been using recently top connect to Strava
5. Health Sync Export and Extract
The Health Sync extract appeared to work with one entry per day (at first glance). The file is a .csv with all the values in the first column. Easy enough to fix this in excel but will attempt this in Power Query today


6. Power Query Data Date Problem
Opening Power BI and selecting ‘Get data’ from text/csv and opting to Transform the data provided us with our second problem with Power Query being unable to parse the dates correctly. For some reason ‘Sep’ is listed as ‘Sept’ which caused a problem for September in every year.


7. Power Query Data Fix
Changing the column to text, running a quick ‘Replace values’ for Sept>Sep, before switching back to a date should fix this and allow us to proceed. (There may be a quicker method but for now I will use this until I am more accustomed to Power Query)


8. Our next clean up steps are to remove redundant columns.
- The time column of ’00:00:00′
- Device column of ‘All steps’
- Average Speed (Unlikely will be used)
- App (location of original Samsung Health file
9. Clean Up (Continued)
A quick check for nulls and duplicates shows us the last few elements to clean up. Keep duplicates shows us the duplicates so we can inspect them first and remove duplicates will get rid of them.
We also set the data types for the columns. In this case we want whole numbers and not text so a quick update and we can start working in Power BI.

10. Measures
We’ll create a few measures next so we are able to see key information such as our average, minimum and maximum steps for any given period. We’ll also do the same for calories and this will support building the graphs and gauges for the interactive dashboard.
Measures will take the form of this example.

11. Building the Dashboard (Gauges)
Using the measures we have just built we are able to build fully interactive gauges that will change based on the month selected with a target of 10k steps per day and some conditional formatting to colour code the gauge based on the valye


12. The daily steps and calorie graph shows the step count and the calorie burn in relation to it. Again, this will update based on the month selected.
I’ll add a slicer to select the month and some customising to make it look presentable and am now ready to publish.

13. Future plans
- Figure out how to remove invalid months (e.g. My data starts in November 2019 but previous months can be selected in the slicer.
- Incorporate my running dashboard data from my Excel dashboard project that can be located here
Thank you for reviewing my project. Please see below for more screenshots of the dashboard covering a range of months so you can compare.
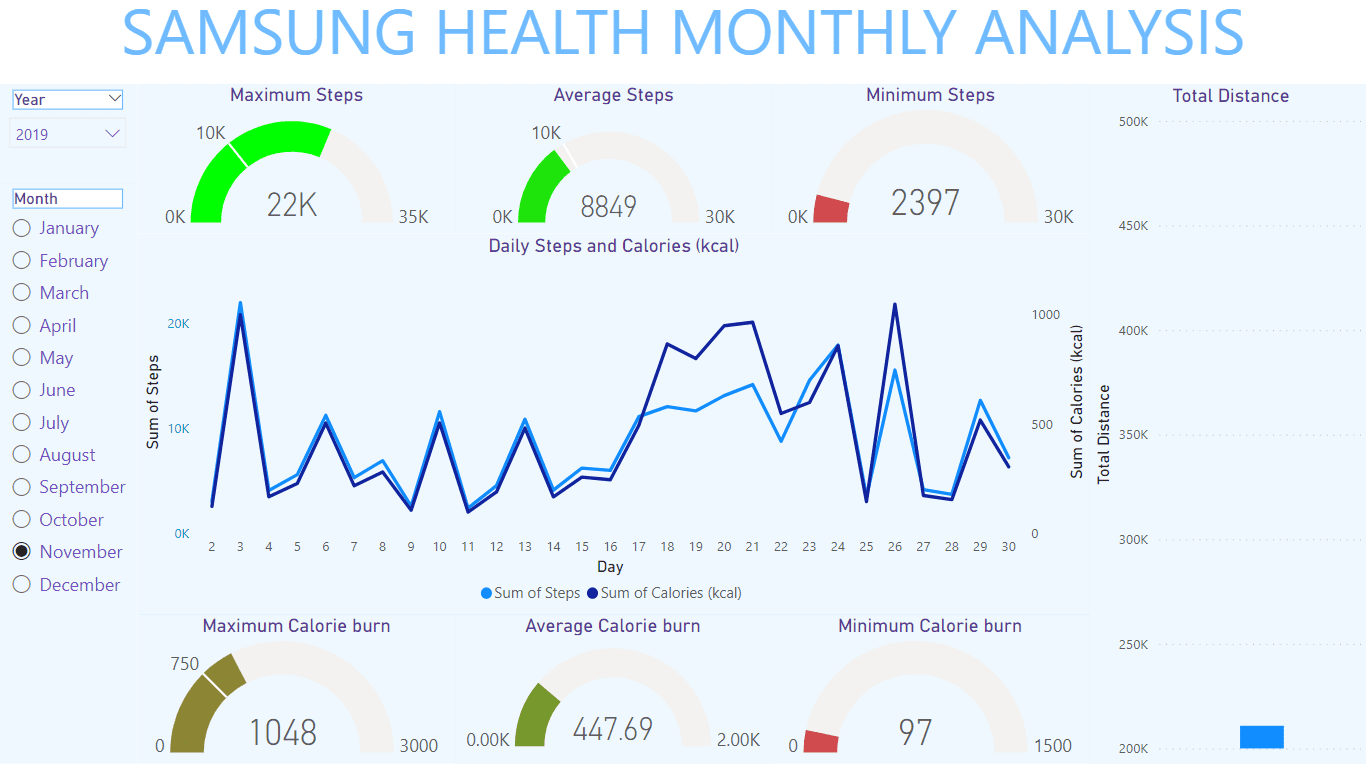
12A November 2019
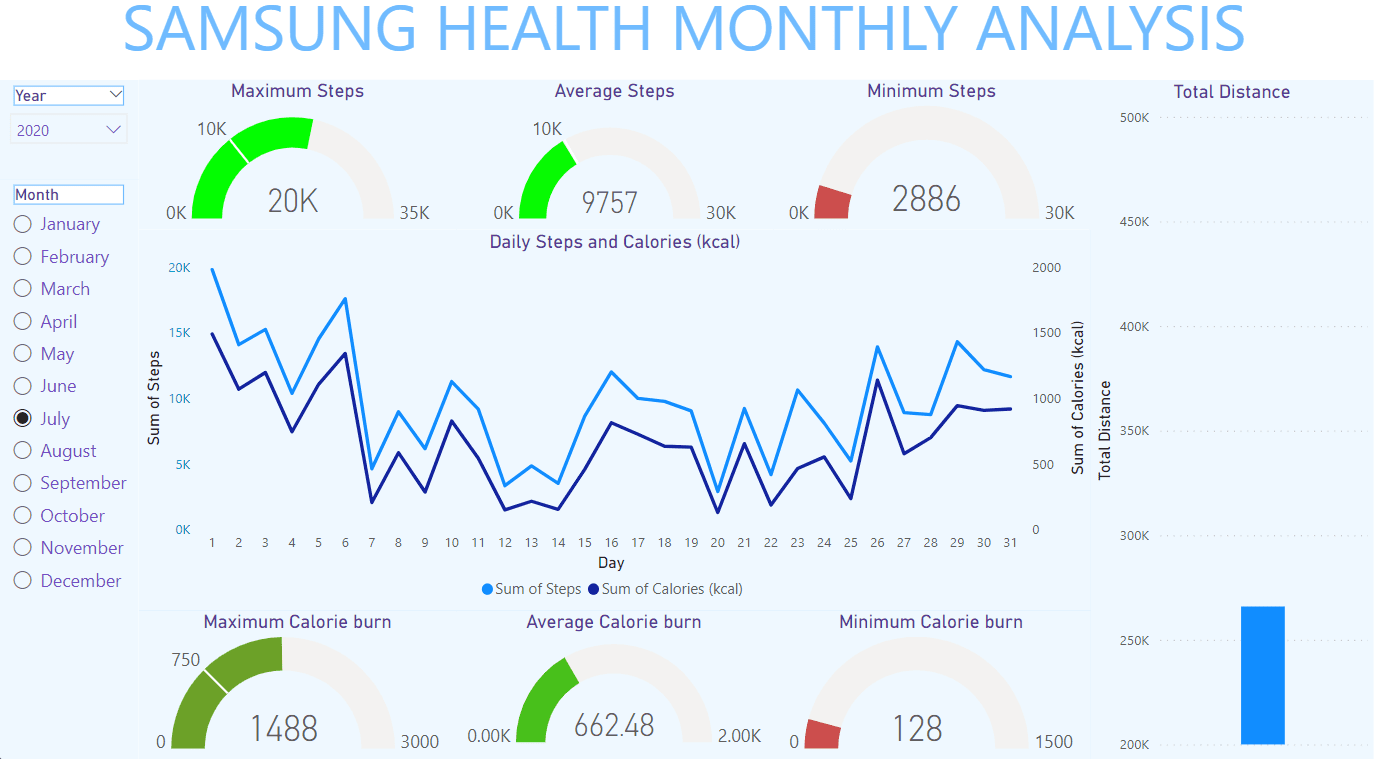
12B July 2020
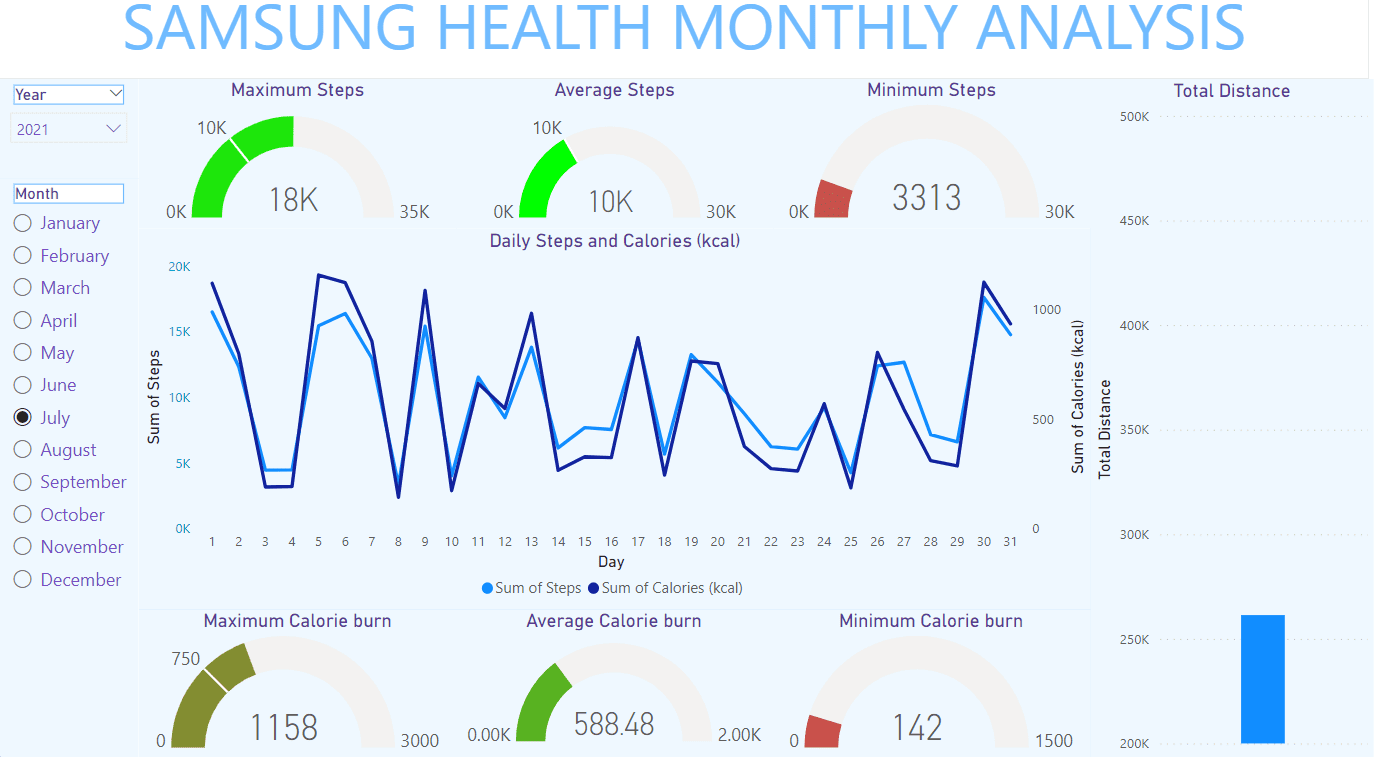
12C July 2021
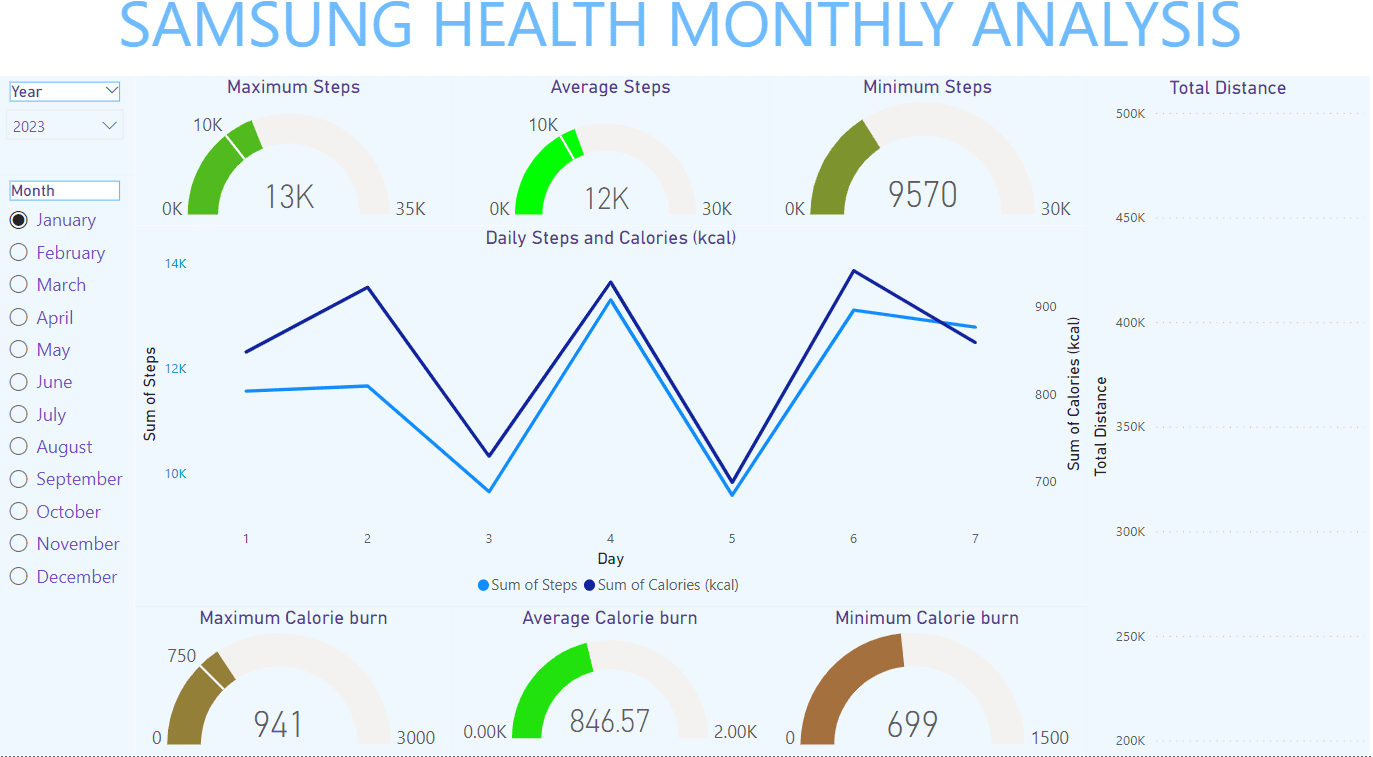
12D January 2023 MTD
Thanks For Browsing!
Let's Build Something
If you are interested in hiring me for a project, would like to collaborate, or have a question, Just drop me a message.
Darryl Brown
Data Analyst who likes working in Excel, SQL, Python and R I also enjoy building websites using WordPress, HTML and CSS. I love learning about tech